Waste Management
An overview of the Waste Management Industry in the US
Introduction and Segments
The Waste and Material Disposal industry is broadly divided into several sub-industries namely non-Hazardous Waste, Hazardous Waste and Oil Cleaning Industries. The largest markets for non-hazardous waste are households, municipalities, commercial establishments and industries generating organic, construction and food waste. The hazardous waste market is primarily one of bio-medical waste, chemical waste and nuclear waste. The smaller segment is the used oil removal and cleaning segment. The sub-industries overlap in the business process and value chain but have specialized industry leaders.
Players
The non-hazardous waste is the largest with a market potential of 67 Billion with the leaders in the US being Waste Management (WM), Republic Services (RPS) and Casella Waste Systems Inc (CWST). The hazardous waste segment is smaller with a market of 20 billion and the specialists being Clean Harbours (CLH), Stericycle (SR, US Ecology (ECOL) and Heritage Crystal Clean (HCCI).The used oil recycling and parts cleaning is the smallest segment led by Clean Harbours and Crystal Clean.
Process Flows
Material Flow

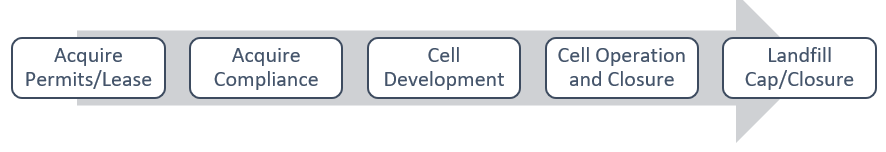
Asset Flow
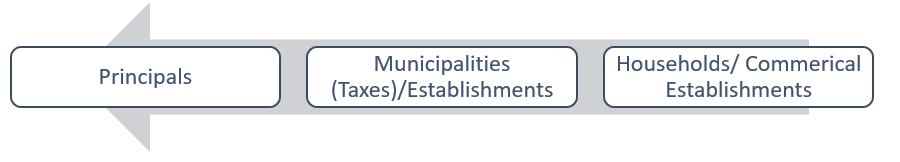
Financial Flow
Revenues
The Revenue Profile of the Waste Management Industry is dependent on
- Continuous Fees to pick up waste from households, commercial establishments and industries
- Container Services – Large One Time Picks up from Festivals, Housing Constructions
- Disaster and Emergency Response – Clean Up and Disposable after emergencies and disasters
- Tipping Fees – Fees paid by third-parties to use landfills and transfer sites
- Facility Clean Up and Parts Cleaning
- Selling Recycled Commodities – Metal, Paper, Glass and Re-cycled Oil
- Selling Gas or Electricity generated from Landfills
- Contracts with households tend to be for a duration of 3 years and commercial and industrial customers are of a duration of 8 -10 years.
- One time fees in the case of events, natural disasters, home improvement and construction activities.
Growth
The industry is low growth industry, keeping pace with the economy. The Revenues Growth of the industry and dependent on
- Population, Commercial and Industrial growth (more activity results in more waste)
- Recycling programs (Mandated activities lead to increased revenues)
- Changes in Pricing, Commodity Prices, etc.
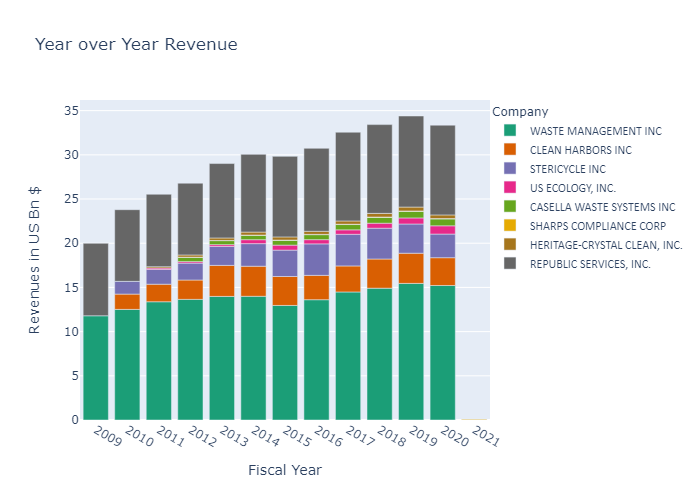
Revenue and Growth Trends in US Publicly Trade Companies
Customers
The Key Customers of the Industry are
- Households, Municipalities and Housing Projects
- Commercial Establishments such as shopping malls, Restaurants and Event Venues
- Industries and Manufacturing Establishments.
Costs
The Primary Costs for the Industry are
- The industry is a Services Industry and the primary cost is Personnel and Labour. The costs of personnel and labour are 18 -20%.
- Equipment Operation, Rental and Fuel Costs are major costs as well
- Operation Costs of Facilities, transfer points, sorting centres, recycling centres, landfills and incinerators.
- The Tipping Fees – Fees charged when using third party facilities to drop off and dispose waste
- There isn’t any significant R&D but S&M is an important element since contracts with municipalities, commercial establishments and industries are of longer horizon.
- Depreciation is a significant non-cash cost since acquired landfill rights and leases are depreciated over the lifetime
- A landfill is divided into cells that are filled with compacted waste. A cell that is full is capped and closed. The costs of creation, operation and closure of the cell depends on the volume of waste that can be packed into the cells. The cost of the cells are recorded against the revenues received.
Margins
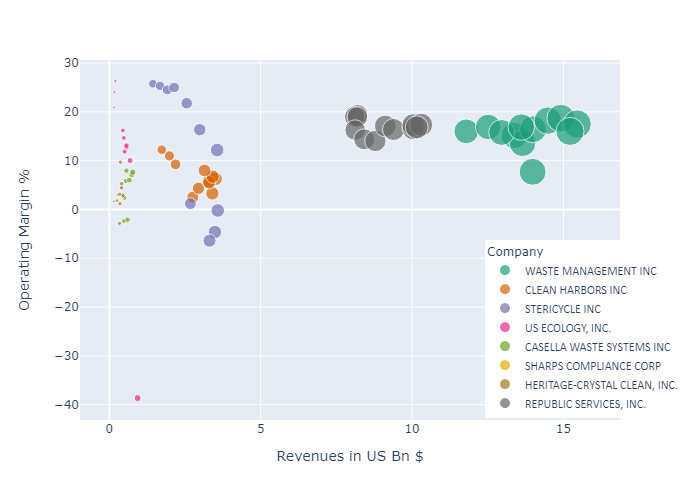
The margins in the industry are stable, between 15% to 20%. The largest operators have the highest margins indicating economies of scale. Economies of Scale exist since costs such as permits, routes and availability of facilities for transfer and sites for landfill can be spread over a larger volume of waste.
Operating Margins by Revenue Size over the Years
Invested Capital
A Key Metric tracked by the organizations is internalization. Internalization as a percentage tracks the volume of waste that is processed using owned facilities such as transfer and sorting stations and landfills. The alternative to using own facilities is leveraging third party facilities resulting in tipping fees. Organizations look to maximize internalization and minimize tipping fees.
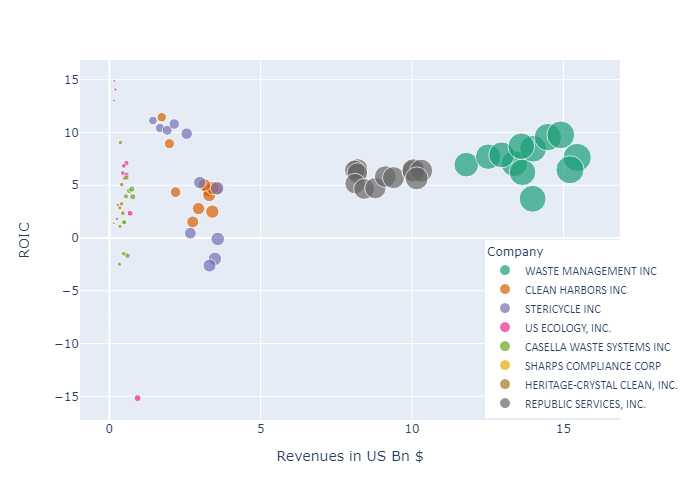
The industry overall shows modest Returns on Invested Capital
Return on Invested Capital over the Year